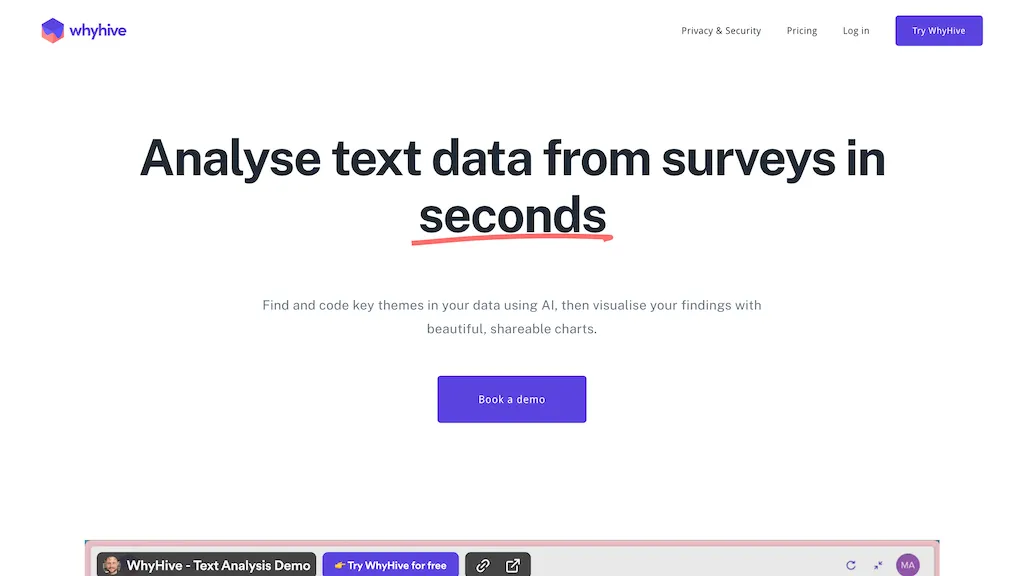
Let us introduce you to WhyHive – an advanced AI tool that makes analyzing survey text data much simpler. It not only helps you sort through complex information but also turns it into beautiful, easy-to-understand charts. WhyHive uses smart AI to quickly find and categorize key themes in your survey responses, saving you from all that tedious manual work.
This clever tool doesn't just make it easy to spot themes; it also helps you visualize your data fast. You'll get engaging, shareable charts, no matter how big your dataset is. Forget about the headache of manual coding – WhyHive lets you see several data columns at once, seamlessly combining text, numbers, and multiple-choice answers.
What really makes WhyHive stand out is its strong focus on your privacy and security. You can relax knowing your projects are kept confidential, and all your data is securely encrypted on Australian servers. Plus, you have total control over your data and can export it whenever you need to.
WhyHive offers a smooth and powerful way to analyze both qualitative and quantitative data, helping you uncover valuable insights without breaking a sweat. It's time to step up your data analysis game with WhyHive and start making some truly insightful discoveries.

